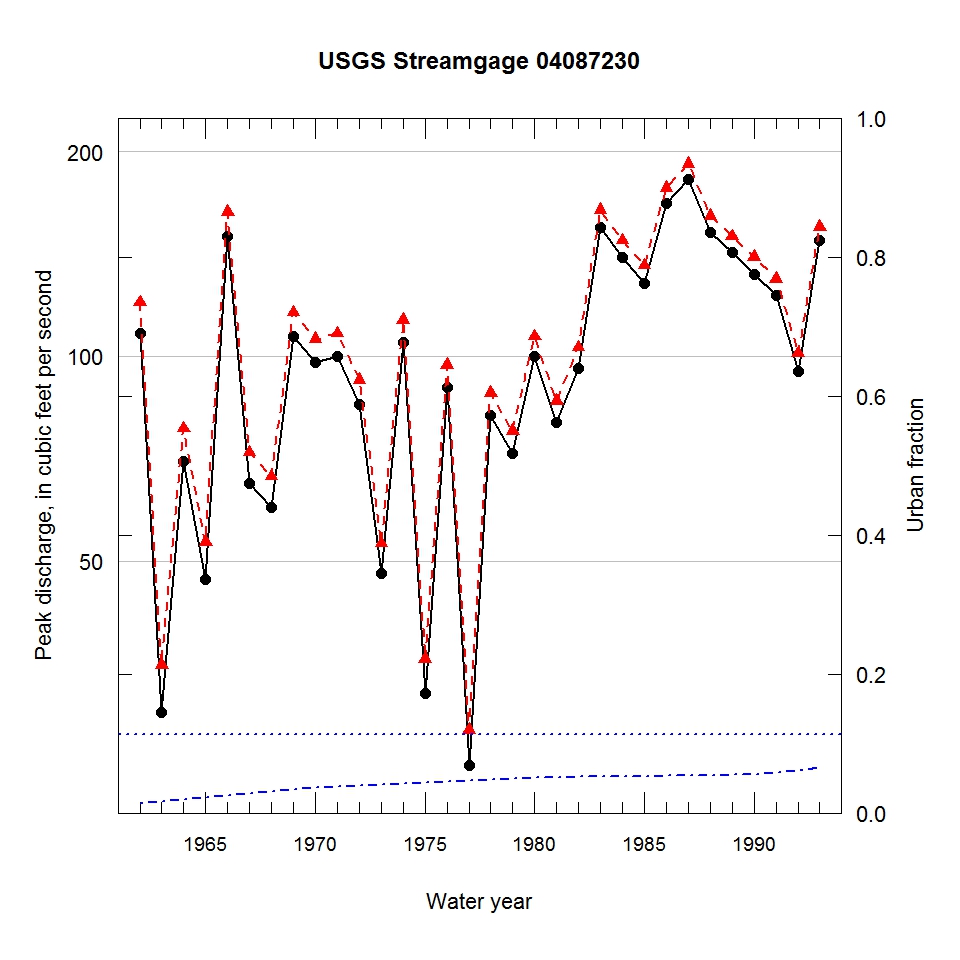
Observed and urbanization-adjusted annual maximum peak discharge and associated urban fraction and precipitation values at USGS streamgage:
04087230 W BR ROOT R CANAL TRIB NEAR NORTH CAPE, WI


| Water year | Segment | Discharge code | Cumulative reservoir storage (acre-feet) | Urban fraction | Precipitation (inches) | Observed peak discharge (ft3/s) | Adjusted peak discharge (ft3/s) | Exceedance probability |
| 1962 | 1 | -- | 0 | 0.014 | 0.020 | 108 | 120 | 0.346 |
| 1963 | 1 | -- | 0 | 0.017 | 0.050 | 30 | 35 | 0.925 |
| 1964 | 1 | -- | 0 | 0.020 | 4.001 | 70 | 78 | 0.644 |
| 1965 | 1 | -- | 0 | 0.023 | 0.130 | 47 | 53 | 0.825 |
| 1966 | 1 | -- | 0 | 0.026 | 0.830 | 150 | 163 | 0.168 |
| 1967 | 1 | -- | 0 | 0.029 | 2.030 | 65 | 72 | 0.691 |
| 1968 | 1 | -- | 0 | 0.031 | 1.250 | 60 | 67 | 0.734 |
| 1969 | 1 | -- | 0 | 0.034 | 2.300 | 107 | 116 | 0.365 |
| 1970 | 1 | -- | 0 | 0.037 | 0.510 | 98 | 106 | 0.425 |
| 1971 | 1 | -- | 0 | 0.039 | 0.950 | 100 | 108 | 0.412 |
| 1972 | 1 | -- | 0 | 0.040 | 1.660 | 85 | 92 | 0.530 |
| 1973 | 1 | -- | 0 | 0.041 | 1.150 | 48 | 53 | 0.827 |
| 1974 | 1 | -- | 0 | 0.043 | 0.550 | 105 | 113 | 0.383 |
| 1975 | 1 | -- | 0 | 0.044 | 0.020 | 32 | 36 | 0.922 |
| 1976 | 1 | -- | 0 | 0.046 | 1.230 | 90 | 97 | 0.492 |
| 1977 | 1 | -- | 0 | 0.047 | 0.620 | 25 | 28 | 0.950 |
| 1978 | 1 | -- | 0 | 0.049 | 1.910 | 82 | 88 | 0.565 |
| 1979 | 1 | -- | 0 | 0.050 | 0.490 | 72 | 78 | 0.648 |
| 1980 | 1 | -- | 0 | 0.051 | 2.700 | 100 | 107 | 0.422 |
| 1981 | 1 | -- | 0 | 0.052 | 0.690 | 80 | 86 | 0.587 |
| 1982 | 1 | -- | 0 | 0.052 | 0.600 | 96 | 103 | 0.451 |
| 1983 | 1 | -- | 0 | 0.053 | 1.150 | 155 | 164 | 0.165 |
| 1984 | 1 | -- | 0 | 0.053 | 1.290 | 140 | 148 | 0.210 |
| 1985 | 1 | -- | 0 | 0.053 | 0.780 | 128 | 136 | 0.265 |
| 1986 | 1 | -- | 0 | 0.054 | 1.080 | 168 | 177 | 0.133 |
| 1987 | 1 | -- | 0 | 0.054 | 2.350 | 182 | 192 | 0.100 |
| 1988 | 1 | -- | 0 | 0.055 | 0.020 | 152 | 161 | 0.174 |
| 1989 | 1 | -- | 0 | 0.055 | 4.331 | 142 | 150 | 0.203 |
| 1990 | 1 | -- | 0 | 0.055 | 1.520 | 132 | 140 | 0.247 |
| 1991 | 1 | -- | 0 | 0.059 | 1.270 | 123 | 130 | 0.293 |
| 1992 | 1 | -- | 0 | 0.062 | 0.950 | 95 | 101 | 0.466 |
| 1993 | 1 | -- | 0 | 0.065 | 2.050 | 148 | 155 | 0.189 |

